How to Set Up Uptime Kuma is something every sysadmin or developer should know if they want a simple, powerful way to monitor their websites, servers, or APIs. Uptime Kuma is one of the best open-source uptime monitoring tools available today it’s lightweight, self-hosted, and super easy to deploy.
With support for HTTP(s), TCP, ping, and push-based heartbeats, Uptime Kuma gives you clean dashboards, real-time alerts, and full control over your monitoring setup. Whether you’re managing a single site or an entire fleet of services, Uptime Kuma helps you catch issues before your users notice.
In this guide, you’ll learn how to install Uptime Kuma using two easy methods: one with Node.js and PM2, and the other using Docker containers for quick setup. Both are beginner-friendly and optimized for performance.
Let’s dive in and get your monitoring system up and running in no time.
In this guide, I’ll walk you through two different methods to install Uptime Kuma on your server:
Method 1: Using Node.js + PM2
Method 2: Using Docker container
But first, let’s start with the recommended server specifications to run Uptime Kuma smoothly.
Recommended VM/VPS Specifications
To ensure Uptime Kuma performs optimally, here are the recommended specs:
CPU: 4 cores
RAM: 8 GB
Disk: 60 GB SSD NVMe (for fast loading)
These specs are ideal if you plan to run multiple monitors or keep long-term logs without performance issues.
Method #1: Install Uptime Kuma using Node.js + PM2
This method involves cloning the source code from GitHub and running the app manually using Node.js and PM2.
Step 1: Clone the Repository
git clone https://github.com/louislam/uptime-kuma.git
Once cloned, move into the project directory:
cd uptime-kuma
Step 2: Install Node.js using NVM
Install Node Version Manager (NVM):
Then, load NVM into your terminal session:
export NVM_DIR="$([ -z "${XDG_CONFIG_HOME-}" ] && printf %s "${HOME}/.nvm" || printf %s "${XDG_CONFIG_HOME}/nvm")"
[ -s "$NVM_DIR/nvm.sh" ] && \. "$NVM_DIR/nvm.sh"
Now install Node.js (LTS version):
nvm install node
Step 3: Set Up the Project
Once Node.js is installed, set up the dependencies:
npm run setup
Step 4: Install and Configure PM2
PM2 helps keep the app running in the background and restarts it automatically if it crashes:
npm install pm2 -g && pm2 install pm2-logrotate
Step 5: Start Uptime Kuma with PM2
Start the server with PM2:
Method #2: Install Uptime Kuma using Docker (Recommended)
This is a faster and cleaner way to install Uptime Kuma using Docker.
Step 1: Install Docker
Install Docker on your server:
apt install docker.io
Verify Docker is installed:
docker --version
If the version number is shown, Docker is ready to use.
Step 2: Run the Uptime Kuma Container
Pull and run the Docker container using the command below:
docker run -d --restart=always -p 3001:3001 -v uptime-kuma:/app/data --name uptime-kuma louislam/uptime-kuma:1
Now open your browser and go to:
http://your-vps-ip:3001
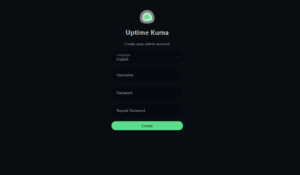
You will see the initial setup screen where you can set up your admin username and password.
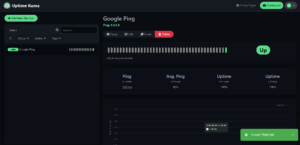
How to Add a Monitor in Uptime Kuma
Once you’re inside the dashboard, you can start adding monitors. Here’s an example to monitor Google DNS.
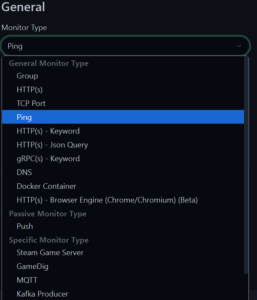
Step 1: Add New Monitor
Click “Add New Monitor”
Select Ping as the monitor type
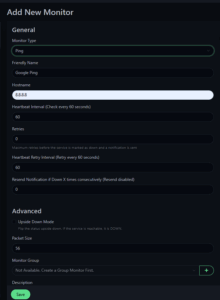
Step 2: Fill in Monitor Details
Friendly Name: Google DNS
Hostname:
8.8.8.8Heartbeat Interval:
60secondsRetry Interval:
60seconds
What do these mean?
Heartbeat is a signal (ping) to check if the service is online.
Retry Interval means if the service doesn’t respond, Uptime Kuma will wait this long before retrying.
You can also assign the monitor to a group and tag it for better organization.
Step 3: Save the Monitor
Once everything is filled out, click Save.
Your monitor is now live and running. Uptime Kuma will start checking the target based on the interval you’ve set.
Final Thoughts
Uptime Kuma is a fantastic tool to monitor uptime and receive alerts when your services go down. Whether you choose the manual Node.js + PM2 method or the cleaner Docker installation, you’re now fully equipped to track your infrastructure with ease.
If you’re looking for a reliable VPS to host your Uptime Kuma instance, You can consider our companie’s VPS Hosting Plans. It’s optimized for monitoring tools like this offering NVMe SSD storage for ultra-fast loading and a reliable network connection with multiple upstream providers, ensuring your monitoring stays real-time and responsive.
Let me know which method you chose, and if you have any questions or require to purchase a ready installed Uptime Kuma Server, feel free to reach out to us below. Happy monitoring!

- Cloudflare Outage? November 2025 Incident - November 18, 2025
- CVE-2025-11953 Critical React Native CLI Security Flaw - November 7, 2025
- How to Deploy n8n on Ubuntu 24.04 - November 4, 2025